

Table of Contents
A survey of 243 Stanford students sheds light on how factors such as race and socioeconomic status influence students’ romantic preferences.
Take a walk through any Stanford dining hall, and you will almost certainly encounter at least one conversation about someone’s love life. It’s no secret that, as college students, romantic interests play an important part in many of our lives.
Given Stanford’s strong focus on diversity and the significant role of romantic interests in students’ lives, the Review conducted a survey to shed some light on how Stanford students’ backgrounds influence their romantic preferences. The survey was distributed to various undergraduate mailing lists. Along with a few basic demographic questions, participants were asked to rate their similarity to their romantic interests in terms of race/ethnicity, socioeconomic status, religion, geographic background, academic interests, and professional interests using the following scale: 1 – not at all; 2 – not really; 3 – neutral; 4 – kind of; 5 – a lot.
243 Stanford students responded to our survey. The following set of charts shows their demographic breakdown and the number of respondents of each category.

Below, we pose a series of questions about students’ romantic preferences and attempt to answer them with data from the survey.
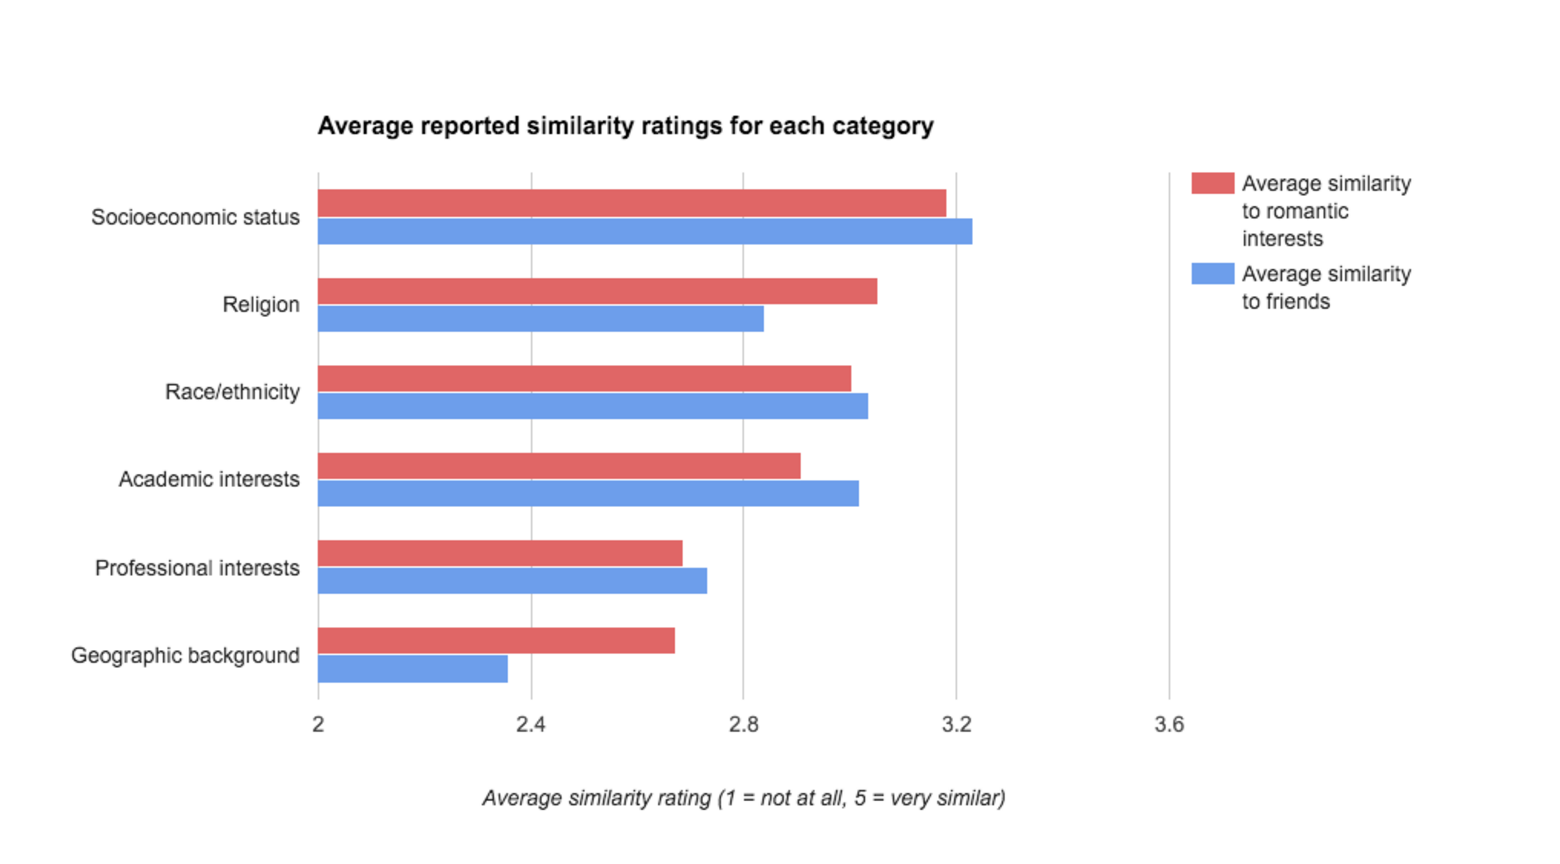
In what ways are Stanford students most similar to their romantic interests? How does this compare with their similarity to their friends?
Survey respondents were most similar to their romantic interests in terms of socioeconomic background (with an average similarity rating of 3.2 out of 5) and least similar in terms of geographic background (with an average rating of 2.6 out of 5).
The chart below shows respondents’ average similarity ratings to their romantic interests and to their friends across each category. Data about friendships was taken from a different Stanford Review survey conducted earlier this year.
Are people of certain socioeconomic backgrounds more likely to be interested in people like them?
Interestingly, middle class respondents were the least likely group to be interested in people of similar socioeconomic backgrounds. Upper middle class respondents reported the highest degree of socioeconomic similarity to their romantic interests, which seems consistent with global trends.
The chart below shows the percentage of respondents from each group who rated their romantic interests’ racial and socioeconomic similarity as “a lot.”
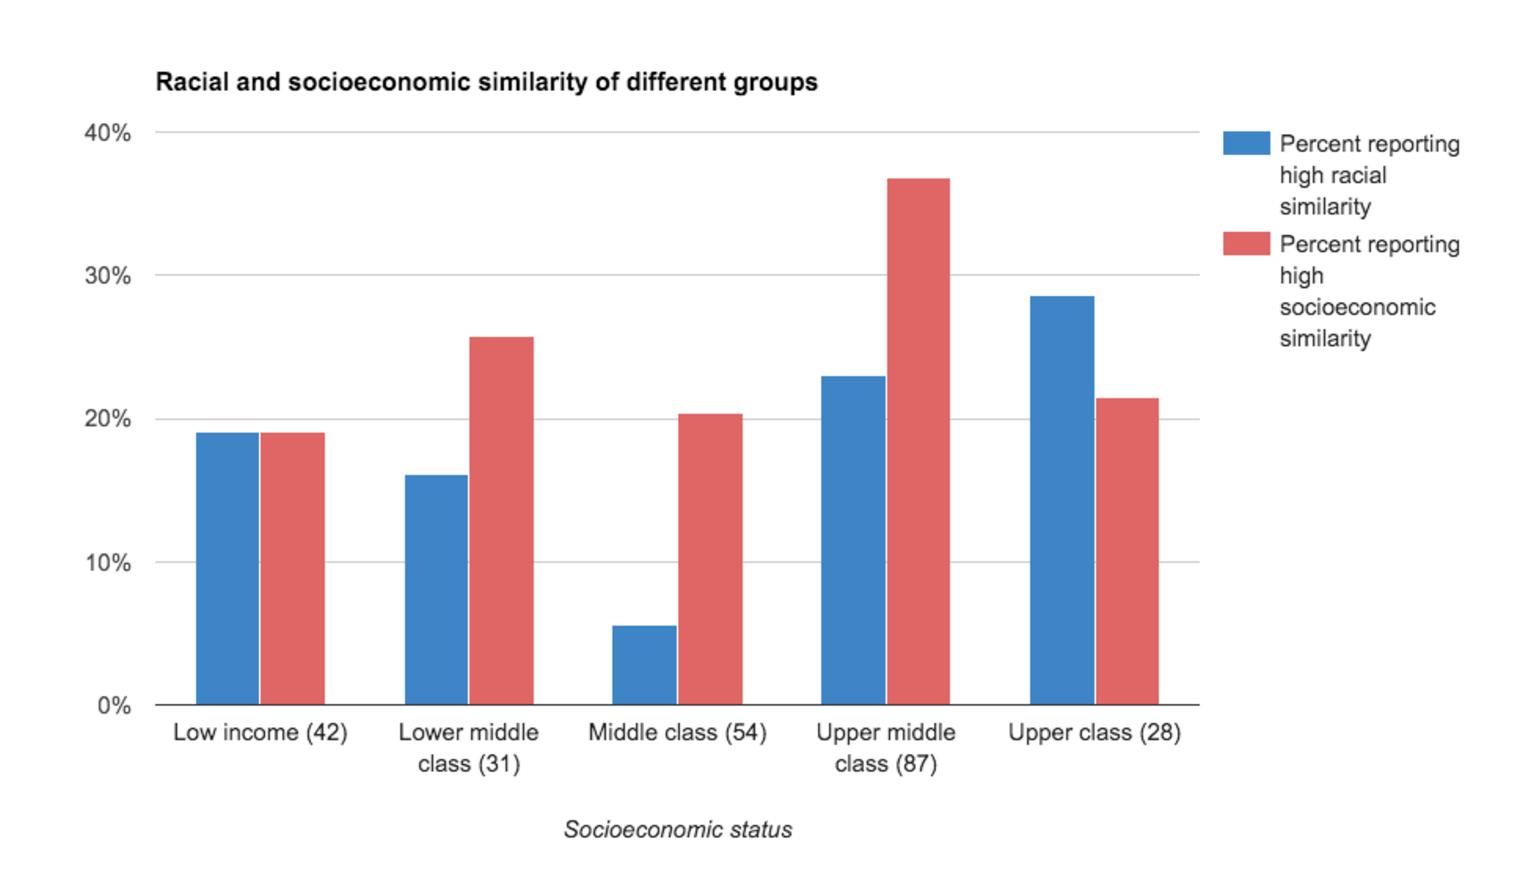
The number of respondents of each socioeconomic class is shown in parentheses next to the label.
Upper middle class respondents were significantly more likely to be drawn to people of similar academic and professional interests as respondents of other groups. They were also more likely to share racial and religious backgrounds with their romantic interests.
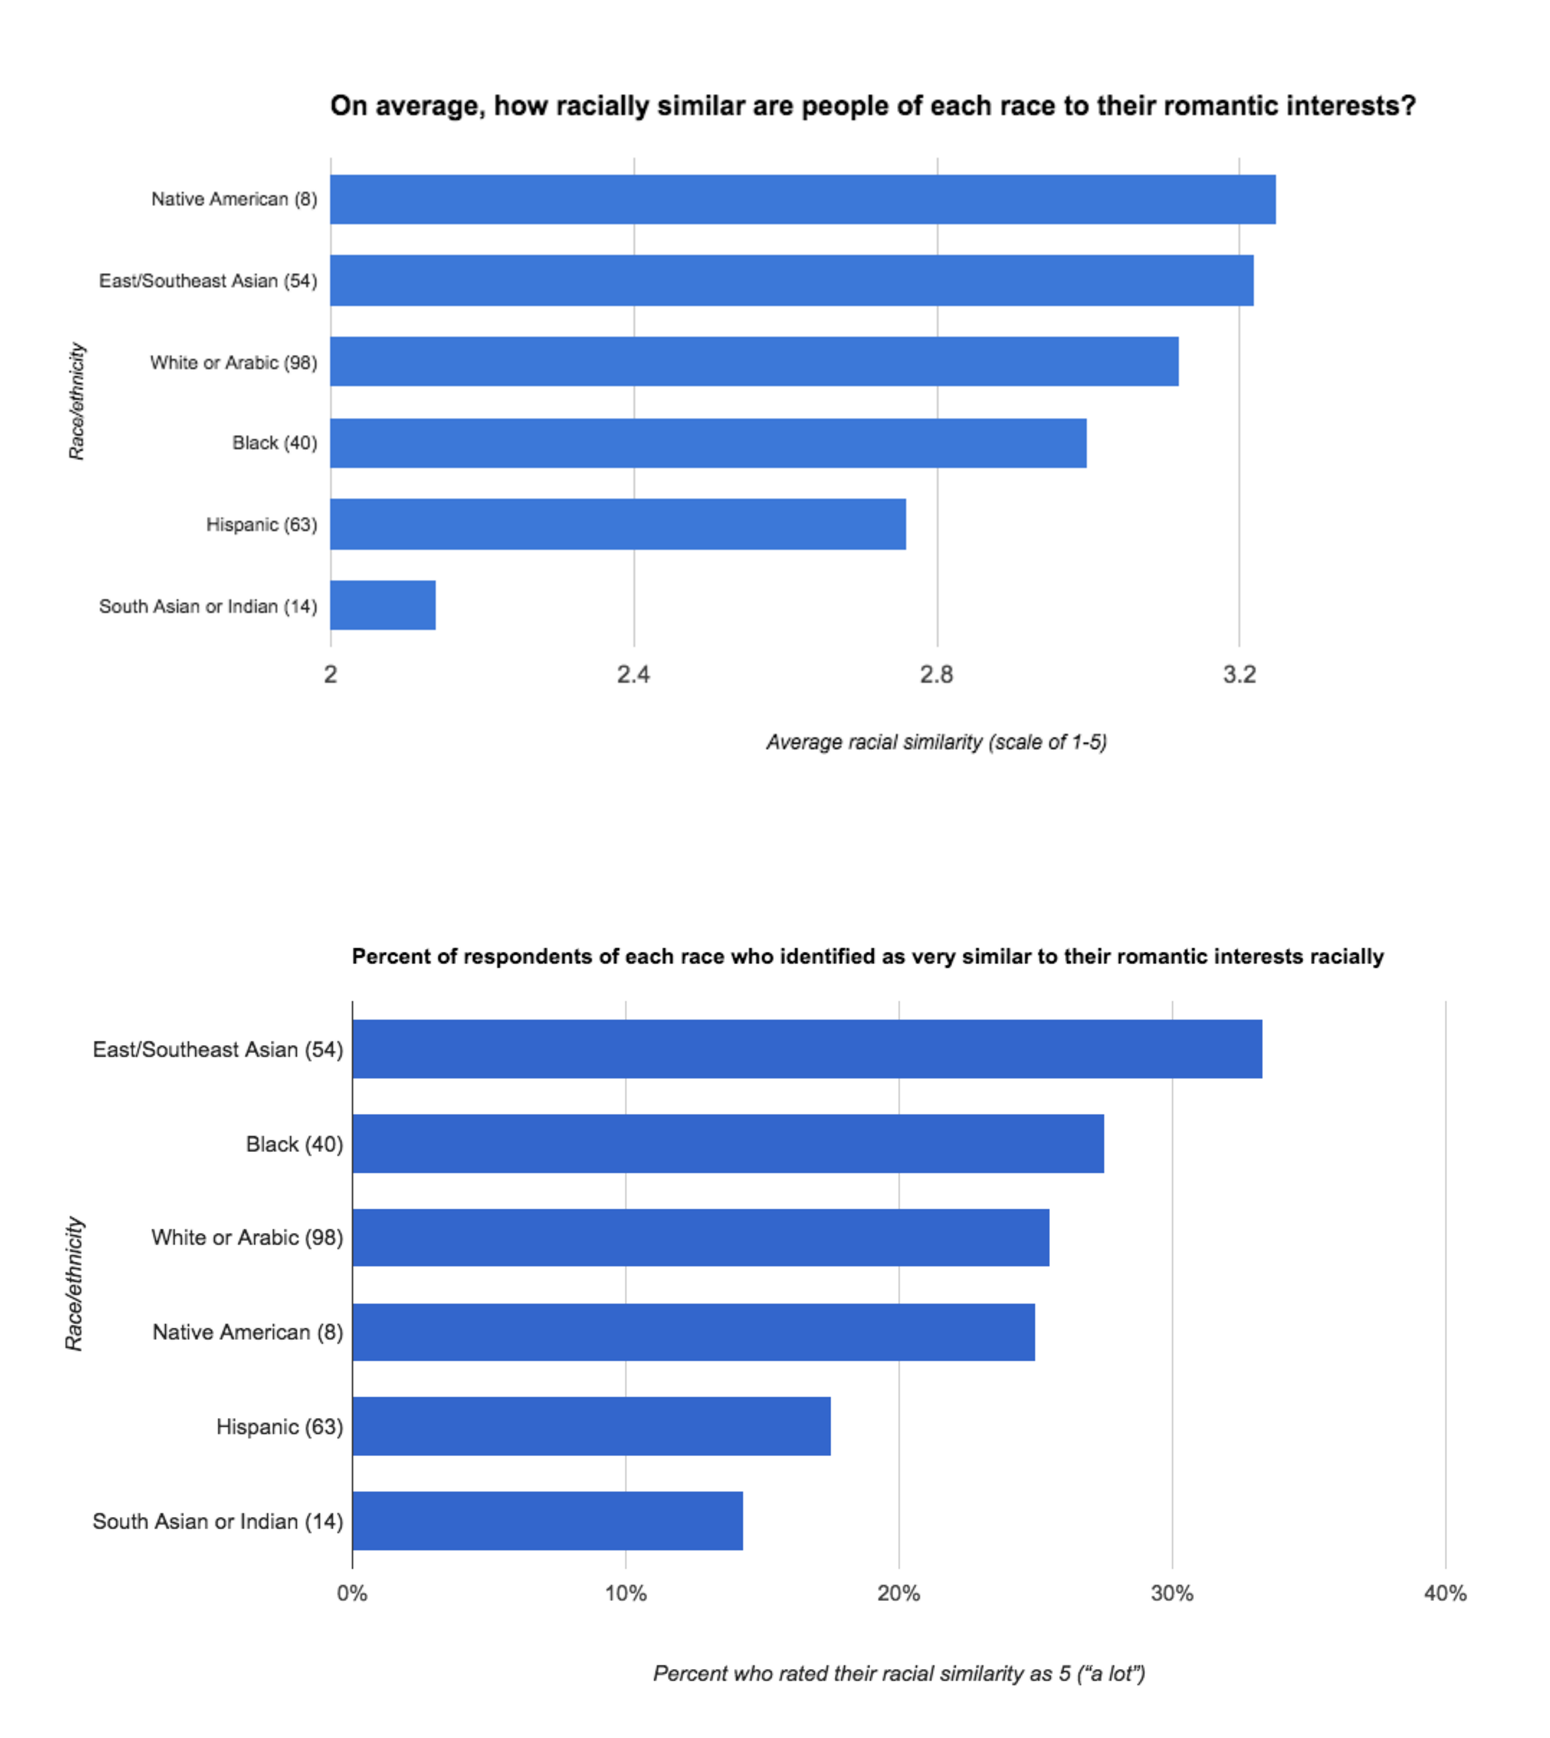
Are people of certain racial/ethnic backgrounds more likely to be interested in people like them?
While students overall seemed open to interracial dating, the degree of openness seemed to vary between people of different races/ethnicities. Respondents who identified as East or Southeast Asian (including Filipinos and Pacific Islanders) had the highest degree of racial similarity to their romantic interests, closely followed by blacks and whites. Hispanics and South Asians were least likely to be interested in people of similar ethnic background.
The chart below shows the average racial similarity ratings for respondents of each race (the number of respondents of each race is shown in parentheses).
White females surveyed tend to have a stronger preference for partners of their own race than white males — and the reverse was true for East/Southeast Asians.
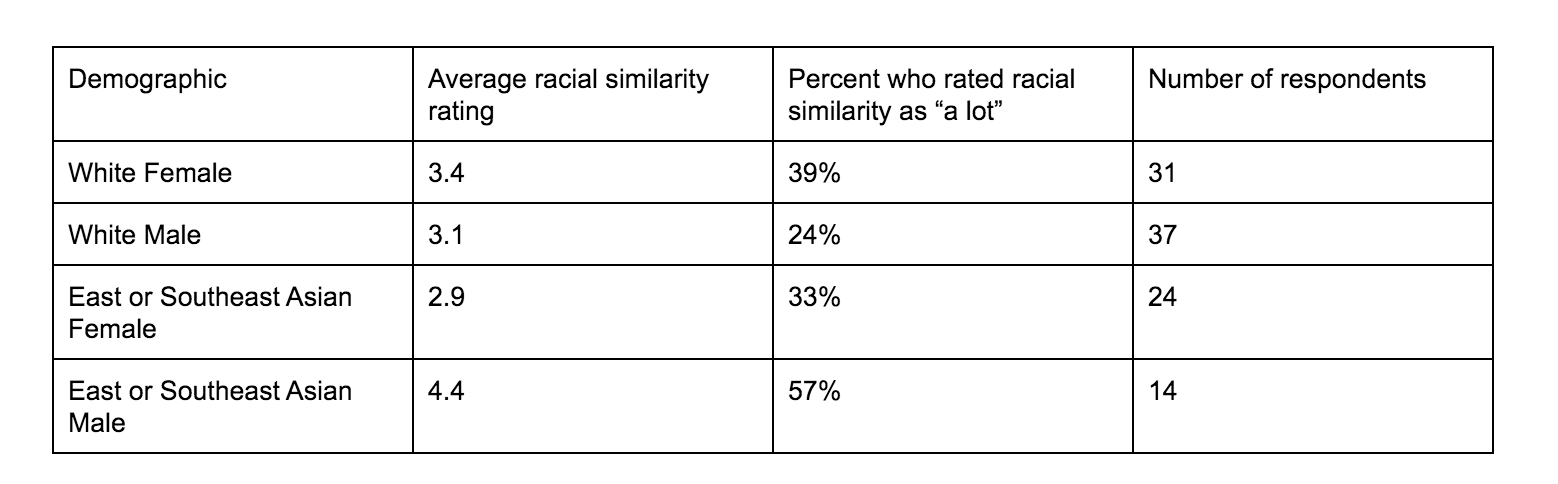
There was no significant difference in racial preferences between males and females of any other races surveyed.
In terms of other characteristics, white respondents were over twice as likely as Hispanics to be very similar to their romantic interests in terms of religious background. And East Asians and Indians were almost twice as likely as the average respondent to be very similar in terms of academic and professional interests.
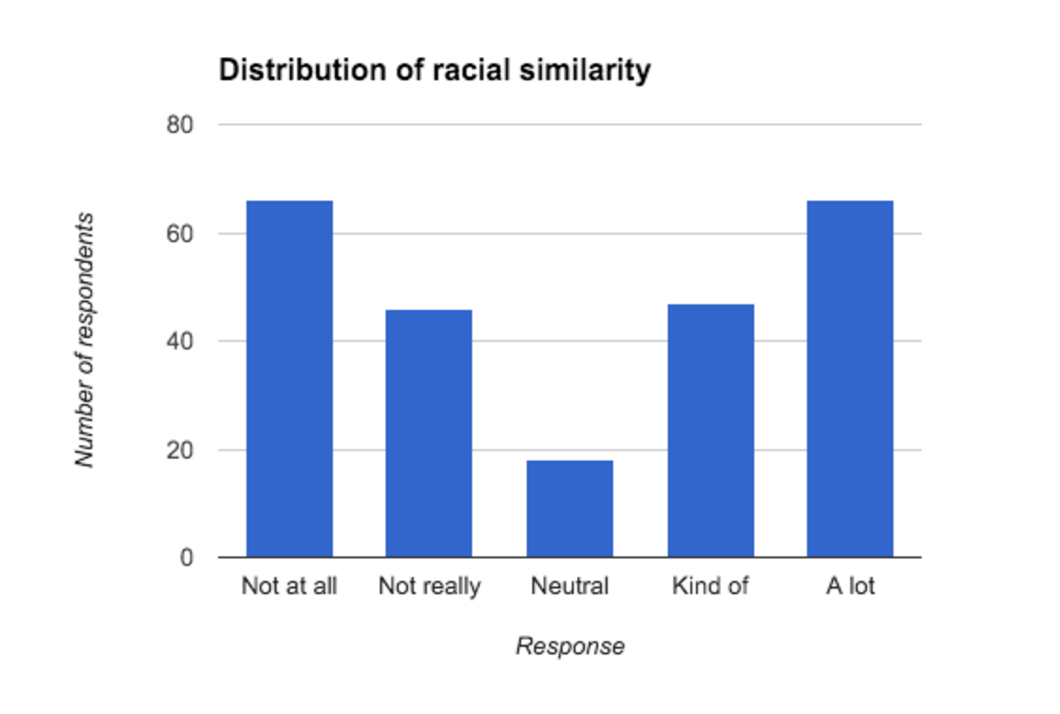
Overall, students were fairly polarized in terms of racial preferences; most students were either very racially similar to their romantic interests or not at all similar.
Are international and LGBTQ students more likely to be interested in similar people?
The 25 international students surveyed were slightly less similar racially and academically to their romantic interests, and significantly less similar religiously than US students. US and international students were almost equally likely to be interested in people from similar geographic regions.
The 48 respondents who identified as LGBTQ+ were slightly more likely to be interested in racially similar people (31% ranked racial similarity as a 5, versus 26% for straight respondents). In other respects, there were no significant differences in their preferences.
Are people in a committed relationships more likely to be similar to each other than those in casual relationships?
People in committed relationships were almost four times as likely to share professional interests with their partners as those in casual relationships. Committed partners were also significantly more likely to be religiously similar than casual ones.
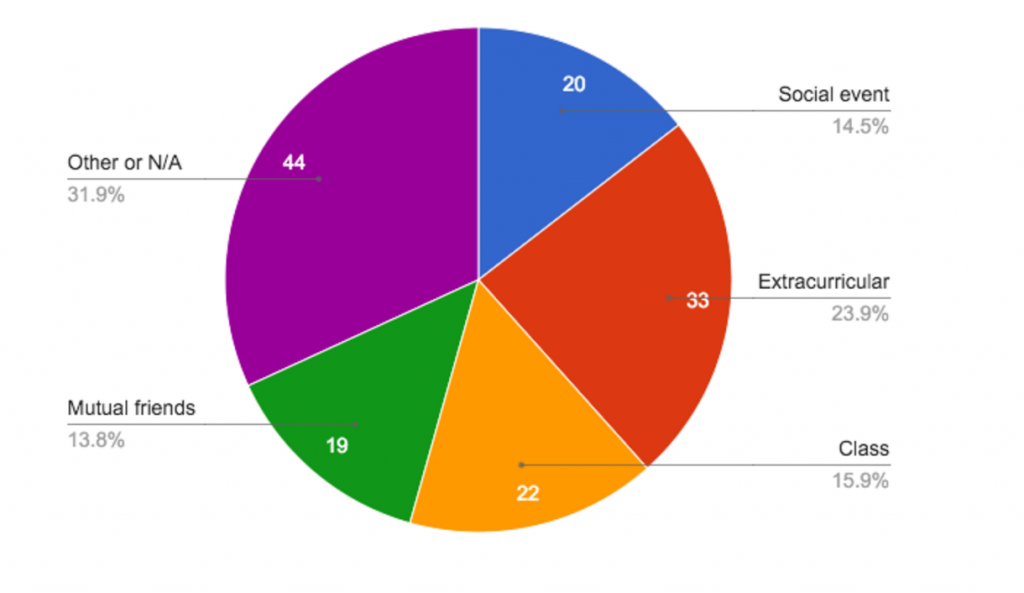
How did most Stanford students meet their romantic interests?
At Stanford, we constantly think about diversity. We host events highlighting our different stories, have discussions about increasing various forms of diversity, and provide countless spaces (from religious groups to ethnic theme dorms) for students to congregate with people of shared backgrounds. Examining the backgrounds of students’ romantic interests offers an interesting perspective on students’ actual mindsets and experiences when it comes to diversity.
The anonymous survey responses can be found here.

