Table of Contents
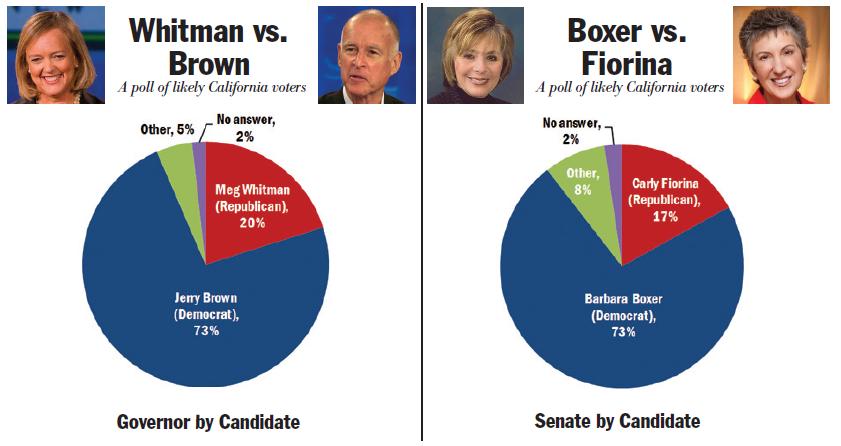
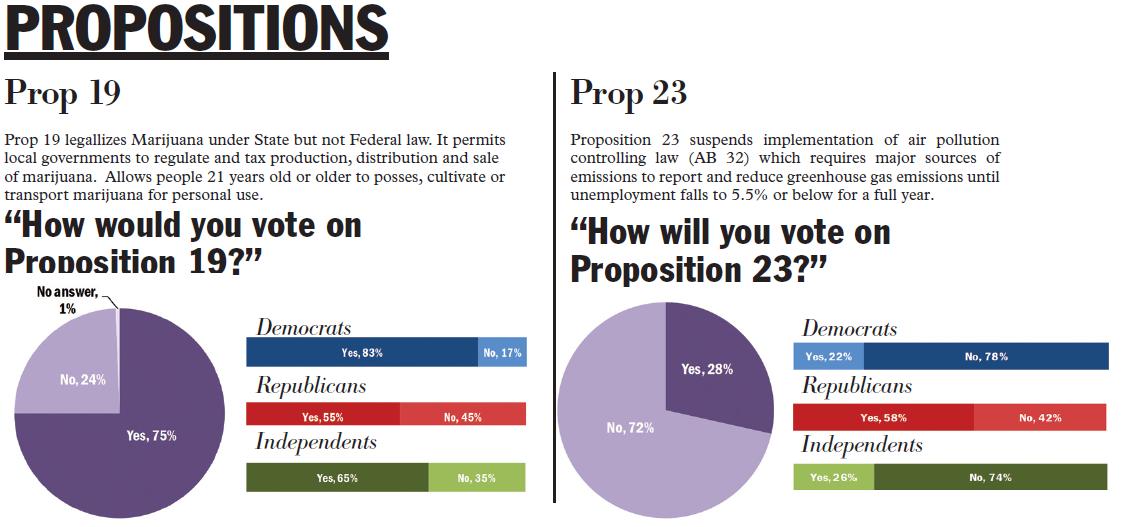
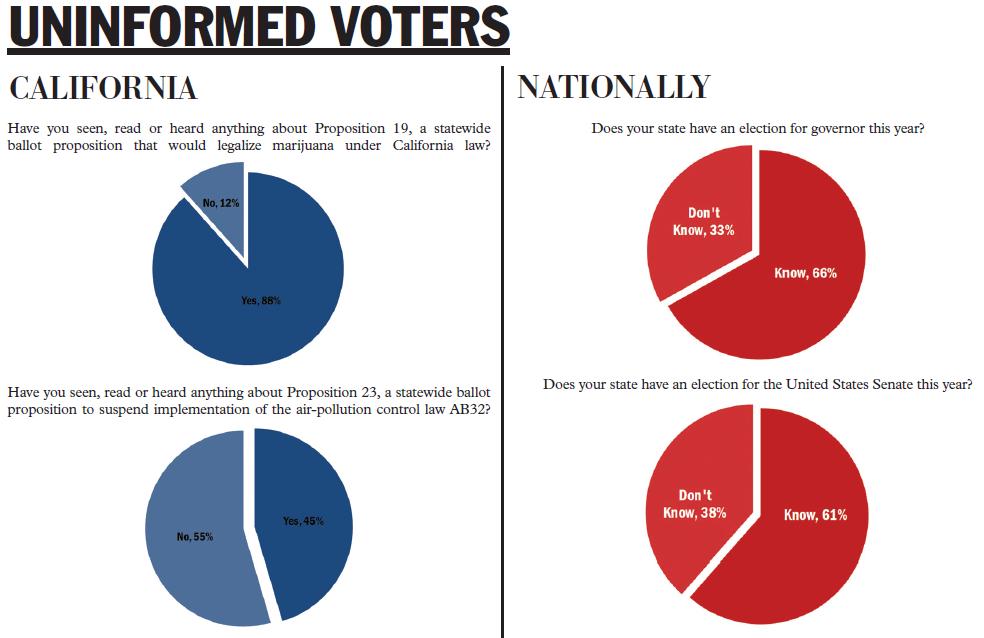
In anticipation of the 2010 midterm elections, The Stanford Review has polled a random sample of Stanford undergraduates to collect information on opinions on the various races and propositions in California and around the country. The Review is excited to present this data, as no such poll has been conducted among a significant chunk of Stanford undergraduates in recent memory.
The poll was conducted from October 12 through October 15. The *Review *sent emails to 2,000 randomly selected undergraduates and received 460 total responses. Of those total responses, 171 indicated that they were registered or intended to register in the state of California and were “definitely” or “probably” going to vote.
As with any attempt to get Stanford students to respond to unsolicited emails, this poll had flaws. Although the response rate was fairly high for an email poll (23% of those emailed took the survey), the number of responders who identified themselves as likely California voters relative to the sample population resulted in a margin of error that was relatively high: around 7%.
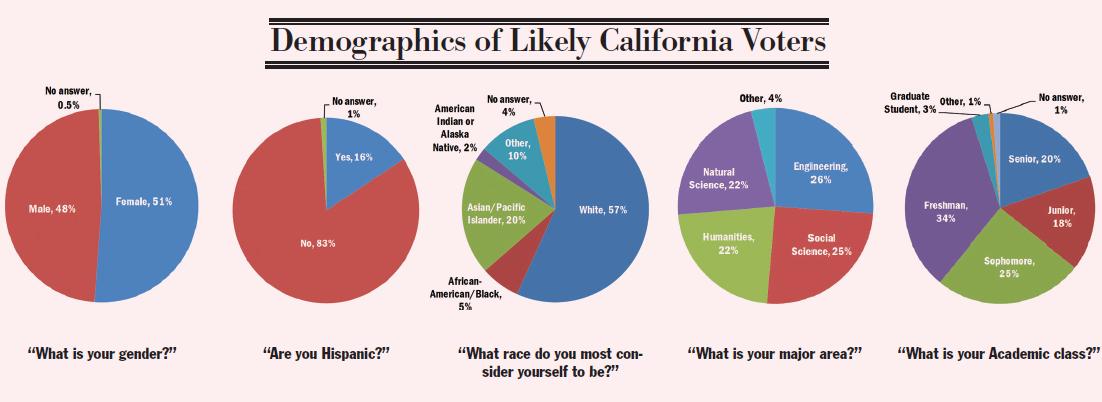
Furthermore, the set of respondents did not entirely accurately reflect the make-up of the Stanford student body. For example, we received more responses from freshmen (34% of overall sample) than seniors (20% of overall sample). The set of responders also had a low proportion of African-American/Black students and a high proportion of Hispanic students (as compared to the actual population demographics of the Stanford undergraduate community).
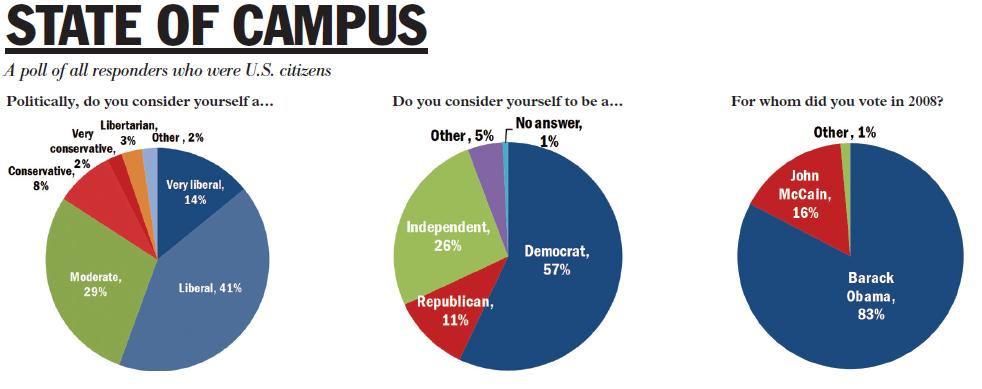
Nonetheless, the data collected—though imperfect—still provide some insight into the political landscape of campus. For example, although the number of students who self-identify as Democrats may not be exactly 62%, the poll does provide confirmation of the liberal tilt of campus and gives an estimate of the magnitude of that tilt.
From this experience, the Review’s poll team has learned a lot about how to go about polling Stanford’s undergrads. In the future, expect more polls and improved accuracy. There’s great value value in hard data for getting the political pulse of campus, and the Review will continue to refine its approach and attempt to provide something of value to our readers.
And for now, we invite you to peruse the data (and with any poll, take it with a grain of salt). You’ll probably confirm some assumptions (such as the leftward tilt of campus), but you might be surprised by some results as well. More details about the data and methodology of the poll can be found at stanfordreview.org.
—Alex Katz, Editor-in-Chief. Quinn Slack and Kyle Huwa also contributed to the writing of the poll and the compiling/analyzing of the data.
Please click on the images below to see larger versions.
Methodology
The findings presented here are based on a Stanford Review survey conducted among Stanford undergraduates between Tuesday, October 12 and Friday, October 15. Emails were sent to 2,000 randomly selected Stanford undergraduates who were asked to fill out a poll regarding the 2010 elections. Only one attempt was made to reach respondents to take the survey. The survey was conducted online. Respondents were permitted to skip questions.
Of the 2,000 asked to fill out a survey, 462 chose to fill out part or all of it. Of those 462, 225 were registered or intend to register to vote in California. 171 of those 225 California voters indicated that they were likely to vote. “Likely” is defined as someone who responded that they were “Definitely Voting” or “Probably Voting” in the 2010 California general election. All data presented on the 2010 California general election is based only on this subset of likely California voters.
Sampling error estimates always depend on the sample size and size of the population being sampled. The maximum sampling error for the likely California voting sample is between 6.5-7.5%.
As noted before, possible sources of error include the overall non-response rate (77%). Additionally, the sample includes a high proportion of younger students, a low proportion of African-American/Black students, and a high proportion of likely voters.

